Transportation carbon footprint
Reading time : 3 minutes
Published on : 25/02/2025
Last update : 20/11/2025

Contents
With 31% of France’s greenhouse gas emissions, transportation is the country’s largest source of emissions, ahead of buildings, agriculture, and industry, each of which accounts for an equal share. Among transport emissions, cars alone account for more than half.
Private vehicules are the main daily mode of transport for 72% of French people (source). However, 47% of respondents believe that at least some of their daily trips could be done by bike (source). And they’re right: half of all trips in France are under 5 km (source). Yet, driving just 5 km in a car emits more than 1 kg of CO2. Why? Because a car weighs between one and one and a half tons, meaning it consumes fuel mostly to move itself, rather than its passengers.
For longer distances, it’s no surprise that air travel emits far more CO2 than trains. But how much more? The climate impact of flying is about 200 times greater than taking a TGV for the same trip within France or to a nearby European destination.
Understanding the scale of different transportation emissions
To compare transport modes, we often use orders of magnitude. This is a factor (typically 10) that helps quantify the impact of one mode relative to another.
For example:
- Cars have 10 times the impact per km as buses.
- Planes have 100 times the impact per km as high-speed trains (TGVs).
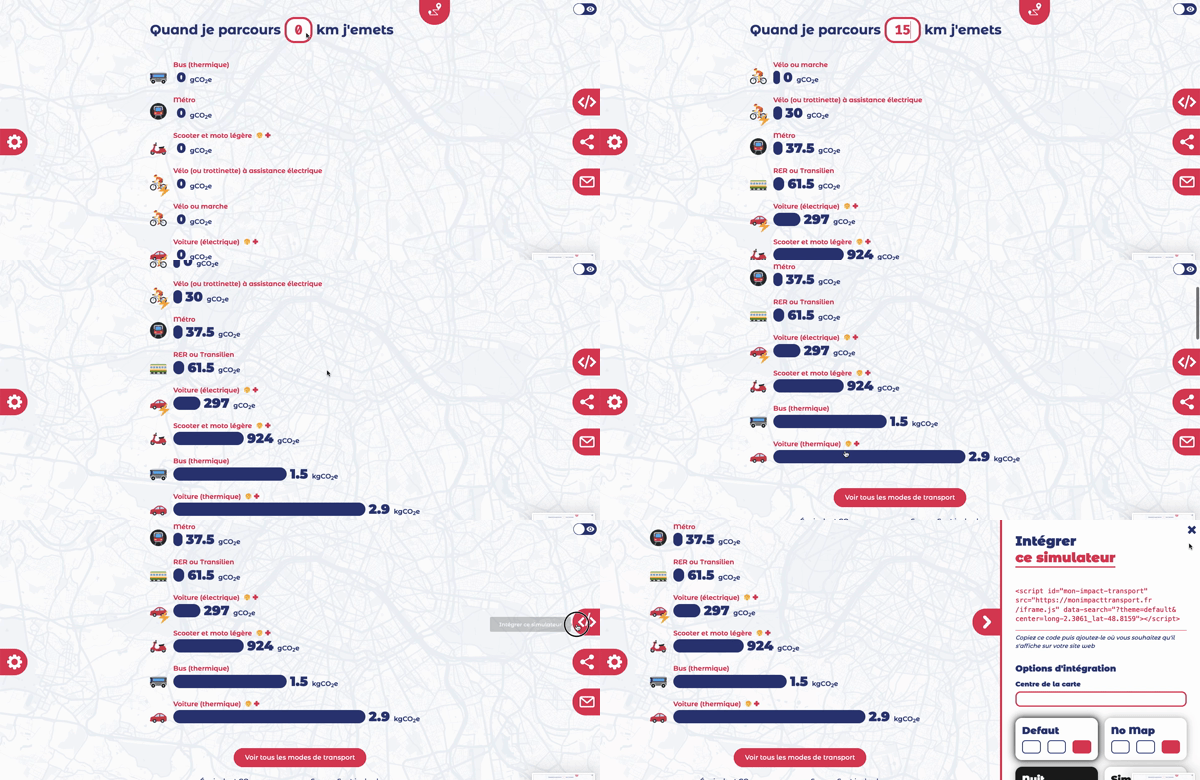
The goal of this calculator is to observe these differences for a given distance and compare various transportation options. It makes these often-overlooked comparisons more tangible when choosing how to travel.
The tool provides a first-level visualization based on average data. It’s not meant to go into excessive detail, such as specific car models, driving styles or vehicle efficiency. While these factors can influence emissions, the overall ranking between transport modes remains largely the same. Switching from one mode to another has a much greater environmental impact than improving efficiency within a single mode, for example, shifting from cars to public transit (buses, trams, etc.).
Finally, aiming a carbon neutrality scenario where we must cut CO2 emissions by a factor of six or more ([see historical target](LIEN INTERNE ARTICLE HISTORIQUE)), this tool highlights that some types of travel will simply no longer be feasible or at least not as frequently because they are incompatible with our climate commitments.
Thus, this simulator helps illustrate how:
- Carpooling, whether for short or long trips, significantly reduces emissions.
- Switching to bikes or public transit can have a major impact.
- Combining multiple transport modes (e.g., driving + regional trains, biking + trains) can cut emissions even further.
Resources for further reading:

Demonstration of Mon Impact Transport
But what does 1 kg of CO2 actually represent? And why count emissions?
Comparing transport modes is a first step. We can see that cars emit 10 times more per km than buses and planes emit 100 times more than trains.
However, it’s harder to imagine what 1 kg of CO2 actually means, for example, how much is emitted by driving just a few kilometers. A kilogram of CO2 doesn’t weigh more or less than any other kilogram, like one you might carry while shopping. But what matters is its impact on the climate.
Measuring our activities in CO2 equivalents (CO2e) allows us to connect our choices to climate change. By quantifying emissions, we can identify where to avoid and reduce them first.
To help put CO2 emissions into perspective, we compare them to the 2-tons COse target per person by 2050, our necessary goal for carbon neutrality.
For example:
- Driving 10,000 km in a car emits 2.53 tonnes of CO2 (with an average car emitting 0.253 kg CO2e/km). However, the average French driver covers 12,000–13,000 km per year.
- A single round-trip flight from Paris to New York (11,700 km) emits 2.6 tonnes of CO2 per passenger.
- Even a round-trip flight to a European capital quickly exceeds 1 tonne of CO2.
These examples show how air travel and excessive driving are already incompatible with the carbon neutrality goals of the coming decades.

Julie,
For the past ten years Julie has been committed to the transition of our society. She joined the Nos Gestes Climat team in 2023 as a carbon specialist and is responsible for the clarity of the calculator and published content.


